To find the z score using the confidence interval, we need to find the area left of the graph. We use the formula;

For instance, in Calculating the Z score for a 95% confidence interval, we have;
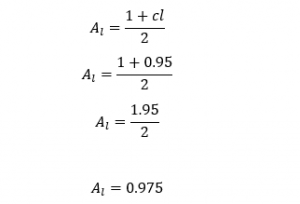
We check the value of probability 0.975 in the positive z score table.
How to read z-score for confidence interval
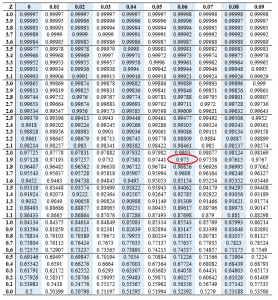
After locating the value in the table, we check the value on the outer zone that corresponds to this value, as depicted below.
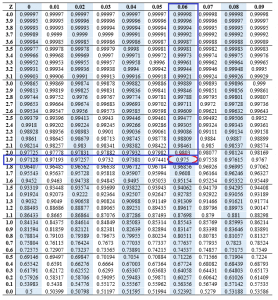
Thus, the z score for the 95% confidence interval is 1.96
Z score for 99% confidence interval
Calculating the Z score for a 99% confidence interval, we have;
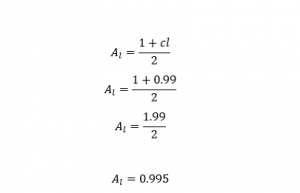
We check the value of probability 0.995 in the positive z score table.
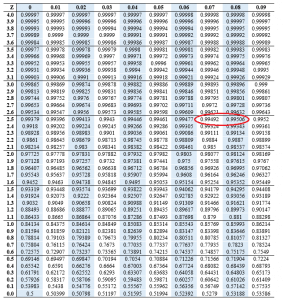
Notably, the value ranges between the values 2.57 and 2.58. Thus, we add the two numbers and divide by two;
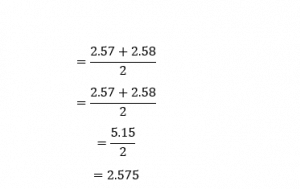
Thus, the z score for the 99% confidence interval is 2.575
Z score for 90% confidence interval
Calculating the Z score for a 90% confidence interval, we have;
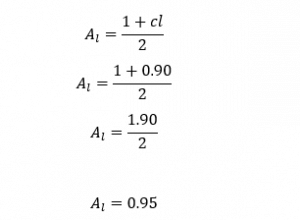
We check the value of probability 0.95 in the positive z score table.
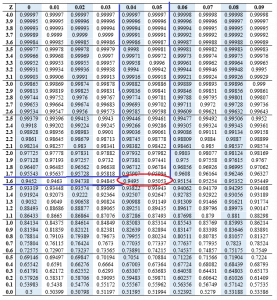
The value ranges between the values 1.64 and 1.65. Thus, we add the two numbers and divide by two;
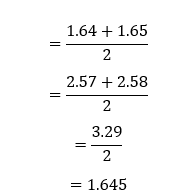
Thus, the z score for the 90% confidence interval is 1.645
Z score for 98% confidence interval
Calculating the Z score for the 98% confidence interval, we have;
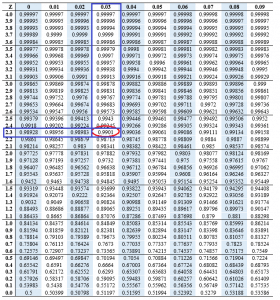
Thus, the z score for the 98% confidence interval is 2.33
Z score for 96% confidence interval
Calculating the Z score for the 98% confidence interval, we have;
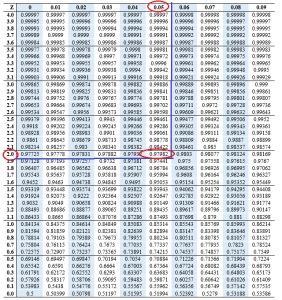
Thus, the z score for the 96% confidence interval is 2.05
Z score for 97% confidence interval
Calculating the Z score for the 97% confidence interval, we have;
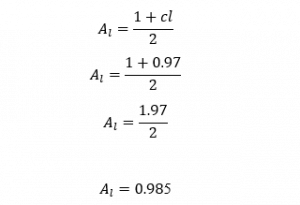
We check the value of probability 0.985 in the positive z score table.
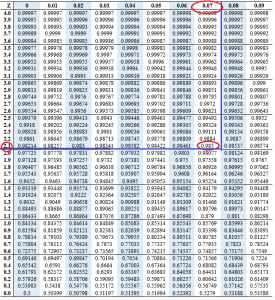
Thus, the z score for the 97% confidence interval is 2.17
Z score for 92% confidence interval
Calculating the Z score for the 92% confidence interval, we have;
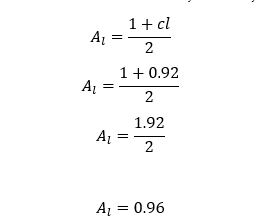
We check the value of probability 0.96 in the positive z score table.
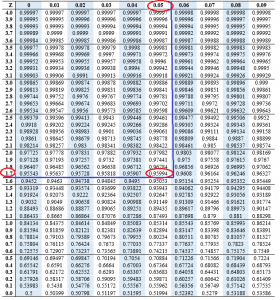
Thus, the z score for the 92% confidence interval is 1.75
