In calculating the probability of the z score, we use both the positive and negative z score tables. For example, let us consider the following probability examples.
Alternative 1
Calculating the probability that a z score is less than the value.
P(x<z)
We check the value from the z score table.
For instance, Given z=2, we can find the probability of the z score as follows;
P(x<2)
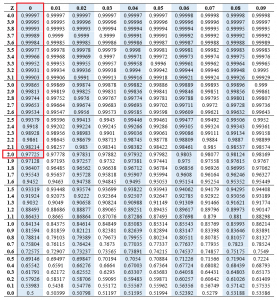
P(x<z)=0.97725
Alternative 2
Calculating the probability that a z score is greater than the value.
P(x>2)
We check the value from the z score table
For instance, Given z=2, we can find the probability of the z score as follows;
P(x<2)

We subtract the value of P(x<2) from 1
Thus, we have;
=1-0.97725
=0.02275
Alternative 3
Calculating the value of P(0<x<z)
We first get the value of P(x>0). We check the z score value of Z=0
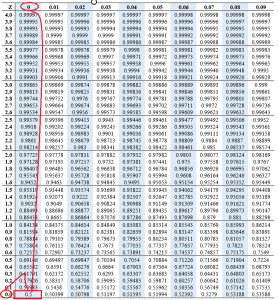
P(x>0)=0.5
The next step is calculating the probability that a z score is less than the value. P(x<2)
We check the value from the z score table.
For instance, Given Z= 2, we can find the probability of the z score as follows; P(x<2)

P(x<2) = 0.97725
Calculating the value of P(0<x<z)
= 0.97725 – 0.5
= 0.47725
Converting z score to probability
If you find the Z-score for a value for any normal random variable (i.e., standardize the value), the random variable is converted into a standard normal, and you can obtain probabilities using the standard normal table.
Is z score a probability?
Z score is not a probability. However, in order to find likelihood and apply standard normal distribution attributes, we can translate any normal distribution into the standard normal distribution.
The z score calculates the likelihood of a score occurrence within our normal distribution and enables us to analyze two scores from different normal distributions.
Probability z score formula
To find the probability of a z score, we apply the z score formula. With the values of the z score, we can check the value of the probability from the standard normal table.
Z-score probability examples
Example of Calculating the Probability of Z-score
A psychology test scores are normally distributed with a mean of 70 and a standard deviation of 10. Compute the following.
a) Probability of students who scores 90
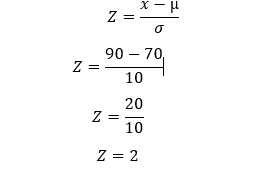
Checking the value in the standard normal table
P(x=2) = 0.97725
b) Probability of students who scored more than 80
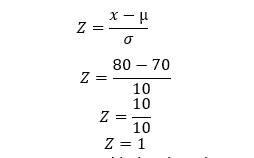
We are considering the value (Z>1)
Checking the value in the standard normal table
P(x=1) =0.84134
The probability of students who scored more than 80 will be;
We subtract the value of P(x=1) from 1
Thus, we have;
=1-0.84134
=0.15866
c) Probability of students who scored a mark that lies between 60 and 90
We are focusing on a value P(60<z<90)
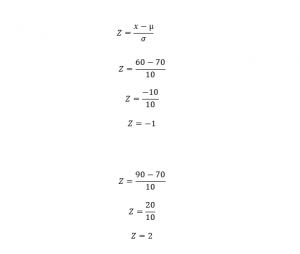
Checking the value in the standard normal table
P(x= -1) = 0.15866
P (x = 2) = 0.97725
The probability of students who scored a mark that lies between 60 and 90 will be given by;
P (x < 90) – P ( x < 60)
= 0.97725 – 0.15866
= 0.81859
Z score probability in excel
Z score probability in excel is calculated using the function NORM.DIST(x, mean, standard_dev, cumulative)
Where;
X is the value one wishes to get, the distribution.
mean is the arithmetic mean of the distribution.
standard_dev is the standard deviation of the distribution.
Cumulative refers to the logical value that determines the form of the function. The TRUE value returns the CDF (cumulative distribution function), and the FALSE returns the PMF (probability mass function).
For example, statistics test scores are normally distributed with a mean of 50 and a standard deviation of 10. Compute the following probability of a student who scores 60 using excel.

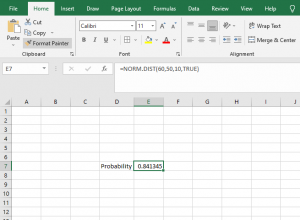
Thus, the probability will be 0.841345
Z score probability in R
Notably, to find the probability value associated with the z score in R, we use the pnorm() function. We use the following syntax;
Pnorm(q, mean=0, sd=1, lower.tail=TRUE)
In the syntax;
q is the Z-score
Mean- is the mean of the normal distribution.
Sd- is the standard deviation of the normal distribution.
Lower.tail- If TRUE, the probability in the normal distribution to the left of q is returned. If the value is FALSE, the probability to the right is returned. TRUE is the default value.
Left-tailed test
Example 1, find the probability value associated with a z score -1.25 in R.

Example 2, find the probability value associated with a z score -2.35 in R

Right-tailed test
Example 1, find the probability value associated with a z score of 1.35 in R

Example 2, find the probability value associated with a z score of 3.05 in R

Two-tailed test
Example 1, find the probability value associated with a z score of 2.45 two-tailed hypothesis test in R

Example 2, find the probability value associated with a z score of 1.67 two-tailed hypothesis test in R

