Difference between z score and t score
The difference between z score and t score is their application in various setups. The Z-score and T-score are commonly used when conducting hypothesis tests or designing confidence intervals, but they differ slightly.
Comparison table of the differences between z score and t score
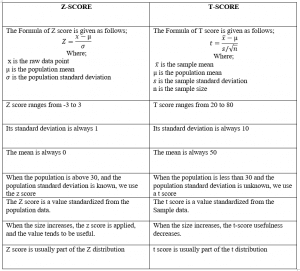
When to use the z score
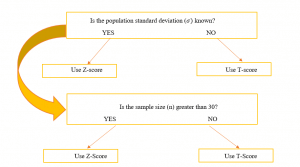
We use the z score to test a hypothesis if the population standard deviation (?) is known and the sample size is greater than 30.
When to use a t score
We use the t score to test hypotheses if the population standard deviation (?) is unknown and the sample size is less than 30.
This information can be summarized in a flow chart as follows;
Examples of the difference between z score and t score
Example 1
The life expectancy of people in the United States is expected to be 80. A survey conducted in 10 regions gave the following data. 84.2, 80.4, 74.2, 79.8, 86.5, 88.0, 83.4, 72.5, 89.8, 86.6. Does the data confirm the expected view?
Solution
In this example, we are working with a sample size of 10. Thus, we will use the formula t-score formula. We begin by noting the null and alternate hypotheses.
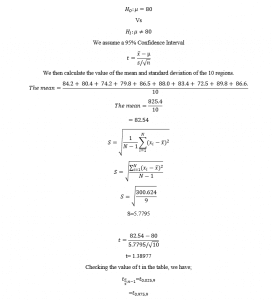
The tabulated two-tailed value is 2.622
Since the tabulated value (2.622) is greater than the calculated value (1.38977), we fail to reject H0 at 5% significance level and conclude that the mean life expectancy in the USA is 80.
Example 2
Suppose a company manufactures phones known to have a lifespan that follows a normal distribution with a mean of 5 years and a standard deviation of 6 months. Suppose 60 phones are taken randomly for the test, and the sample mean was found to be 6 years. Perform a hypothesis test to determine if the lifespan of the phones is expected to be 5 years.
Solution
In this question, we will apply the z score formula since the number of observations is 60.
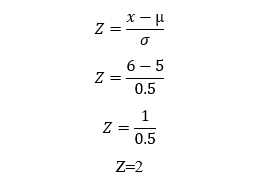
Getting the value of Z score=2 in the z score table, the value will be 0.97725
The P-value is 0.97725, which is greater than 0.05. Thus, this value is not statistically significant. We conclude that the lifespan of the phones in the company is not 5 years.
Example 3
A farmer claims that his bag of beans contains at most 30% of white striped beans. Fifteen samples were taken, and the following results were obtained. 26.3, 27.0, 27.5, 27.4, 28.8, 27.1, 27.0, 28.5, 27.9, 27.5, 26.7, 27.8, 29.7, 27.6, 28.7. Check the farmer’s claim at a 1% significance level and draw the conclusion.
Solution
In this example, we are working with a sample size of 15. Thus, we will use the formula t-score formula. We begin by noting the null and alternate hypotheses.
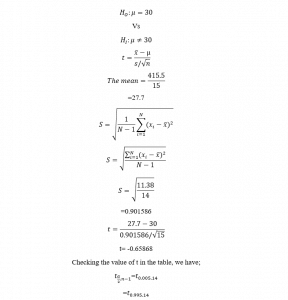 The tabulated two-tailed value is 2.9768
Since the tabulated value (2.9768) is greater than the calculated value (-0.65868), we fail to reject Ho at 1% level of significance and conclude that the farmer claims that his bag of beans contains at most 30% of white striped beans.