Notably, to calculate the z score in excel, one must understand how the z score works. Check out the formula for Z-Score
The z score measures several standard deviations above or below the given data points. To calculate the Z score, one has to take the data point, subtract the mean value, and divide it by the standard deviation value.
To calculate the Z-score, one needs a set of data to provide the mean and the standard deviation.
The Excel formula or Function of Z score
The excel formula or function of calculating the Z score is; =STANDARDIZE (x, mean, standard_dev)
Where x is the raw score
Mean is the average number
Standard_dev is the standard deviation of the values
Process of Calculating Z-Score in Excel (with example)
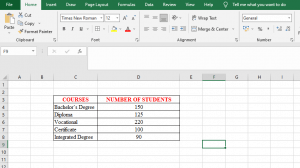
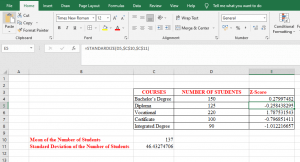
For instance, an institution wishes to calculate the z score of students perusing different types of courses. This encompasses Bachelor’s Degree courses, Diploma Courses, Vocational Courses, Certificate courses, and integrated Degree Courses.
Suppose we have a data set of an institution on the courses offered, we can find the z score value for every course offered as follows.
Step 1: Inputting the values of the data given.
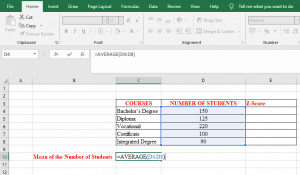
Step 2: Calculating the mean of the dataset
The formula for calculating the mean of any given range of values is =AVERAGE (Range of Values)
Thus, the mean is 137
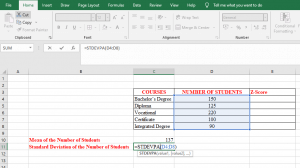
Step 3: Calculating the Standard Deviation of the Dataset
The formula for calculating the standard deviation of any given range of values is = STDVPA (Range of Values)
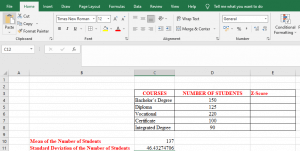
Thus, the standard deviation is 46.43
Step 4: Finding the z-score for the courses
We use the formula. Check out the formula for Z-Score
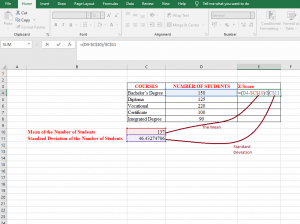
The z-values of each course will be;
ALTERNATIVELY
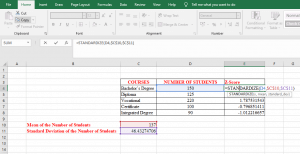
One can use the formula set in excel for the calculations. The formula that one should input is: =STANDARDIZE (x, mean, standard_dev)
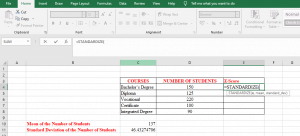
The values will be
How to make a z score chart in excel
To make the z score chart in excel, We have to find the values of the normal distribution.
To find these values, we use the formula =NORM.DIST(x, mean, standard_dev, pmf)
For example, using the above example, we have;
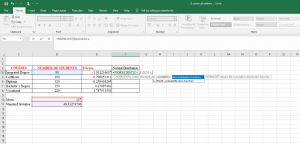
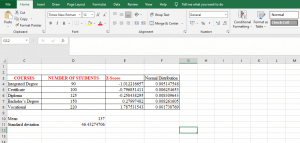
The values of the Normal Distribution will be;
We then insert a graph as follows;
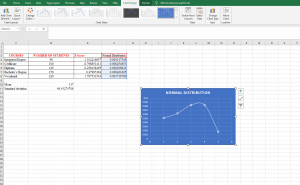
As the Z chart shows, the graph is negatively skewed since the values are concentrated on the right side of the graph, and the left tail of the graph is longer.
How to interpret z-scores in Excel
The z score tells us how many standard deviations away a value is from the mean. Notably, the z value can be positive or negative, ranging from -3 standard deviations up to +3 standard deviations.
A positive z-score shows a value that is more than the mean, a negative z-score implies a value less than the mean, and a z-score of zero denotes a value equal to the mean.
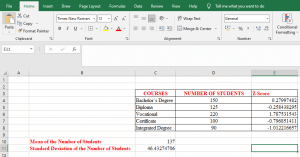
From our above example, the Bachelor’s degree course has 150 students and a z score of 0.27997482. The Bachelor’s degree students are 0.27997482 standard deviations above the mean.
The Diploma course has 125 students and a z score of -0.258438295. The Diploma course students are -0.258438295 standard deviations below the mean.
The Vocational courses have 220 students and a z score of 1.787531543. The vocational course students are 1.787531543 standard deviations above the mean.
The Certificate courses have 100 students and a z score of -0.796851411. The certificate course students are -0.796851411 standard deviations below the mean.
The Integrated Degree has 90 students and a z score of -1.012216657. The integrated degree students are -1.012216657 standard deviations below the mean.
Notably, the greater the distance between a value and the mean, the larger the absolute value of the z-score for that value.
For instance, the number of students taking integrated degree courses is 90, which is further away from the mean (137) compared to the number of students taking Diploma courses which is 125, which explains why the integrated degree students have a z-score with a larger absolute value.