What is the empirical rule?
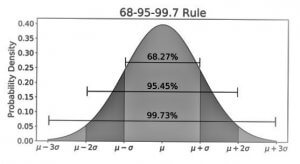
The empirical rule is a numerical rule (also known as the three-sigma rule or the 68-95-99.7 rule) that asserts that almost all data for normality of data will plunge within three standard deviations on either side of the mean.
The empirical rule is used in a normal distribution to forecast potential scenarios. A statistician, for example, can use this to approximate the number of cases that fall within every standard deviation.
Notably, the empirical rule is employed as follows;
- 7% of the data falls within the three standard deviations
- 95% of the data falls within the two standard deviations
- 68% of the data falls within one standard deviation.
The Empirical rule formula
The empirical rule formula applies as follows;
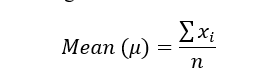
(Step 1), calculate the mean of the values given. The mean can be calculated using the formula;
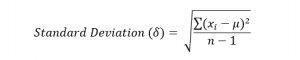
(Step 2), calculate the standard deviation.
The empirical rule formula is applied as follows;
- 99.7% of the data falls within the three standard deviations. This means that the data falls between μ-3δ and μ+3δ
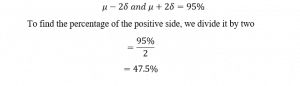
- 95% of the data falls within the two standard deviations. This means that the data falls between μ-2δ and μ+2δ
- 68% of the data falls within one standard deviation. This means that the data falls between μ-δ and μ+δ
For instance, the test scores in a Psychology test are normally distributed with a mean of 50 and a standard deviation of 10. Applying the empirical rule formula, we can analyze the data as follows;
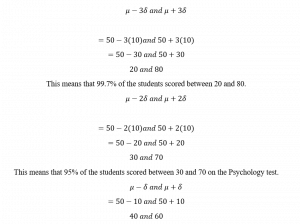
This means that 68% of the students scored between 40 and 60 on the Psychology test.
The empirical rule is commonly used in empirical studies, such as when evaluating the likelihood of a specific piece of data happening or predicting outcomes when not all evidence is accessible.
Notably, one can use the empirical rule when the data is normally distributed or unimodal.
Relationship between empirical rule and z score
The z-score indicates the number of standard deviations x is from the mean. The greater the distance z from zero, the more “atypical” x is concerning the given data set.
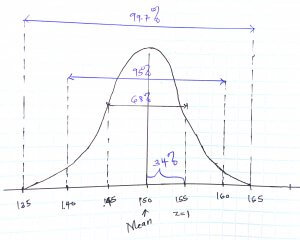
Undoubtedly, the “empirical rule” asserts that for approximately bell-shaped dispersion, approximately 68 percent of the datasets will have z-scores between 1, approximately 95 percent between 2, and approximately 99.7 percent between 3. Let’s follow this with an example.
Example
Suppose that the mean height of students in a class is 150cm and has a standard deviation of 5 cm. If Winston has a height of 155cm, calculate the z score and give the relationship between the empirical rule.
Solution
We shall use the Z score formula which we covered previously
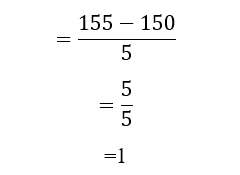
The height of Winston is 5cm above the mean and has a standard deviation of 1. This means that the value is one standard deviation away from the mean.
This means that Winston lies approximately 34% of the distribution within one standard deviation of the mean.
Notably, the z score of positive (+1) depicts that the data is approximately 34% of the distribution following the empirical rule or the 68-95-99.7% rule.
The Empirical Rule is easier to apply when the percentages are distributed evenly. The 68 percent can be divided into 34 percent on each side of the Mean, resulting in 34 percent of the Distribution from the Average to the First Z-score.
This also applies to the 95 percent. If it is divided in half, the Mean and Second Z-score will be separated by 47.5 percent.
To calculate the percentage difference between the First and Second Z-scores, subtract 34 percent from 47.5 percent: 47.5 percent minus 34% equals 13.5 percent.
In a nutshell, the relationship between the empirical rule and the z score is that the z score value dictates the dataset’s percentage that falls in a given standard deviation range.
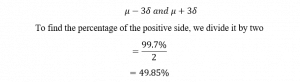
For example, following the above example, a z-score of +3 corresponds to the empirical percentage of 49.85%.
Arguably, it can be calculated as follows;
A z-score of -2 corresponds to the empirical percentage of 47.5%.
It can be calculated as follows;